Update: AUDJPY (short) stop change

•July 17, 2012 • Leave a Comment

Our short on the AUDJPY, currently up 128 pips, is one that we’ve had to re-assess over the past day given the wave formation it’s traced out over the past week.

Currently, momentum in USDJPY is strongly bullish while momentum in AUDUSD is slightly bearish, giving a net bullish momentum bias to AUDJPY. Moreover, the 8H chart suggests we may be in the second half of wave D of a large triangle that began in November 2011. If this is the case, we would expect price to rise as high as 84.70 (the point at which wave triangle wave D equals 61.8% of triangle wave B) or even 88 (the top triangle trendline). Wave C travelled 80% of the distance travelled by Wave A, so this pair could still have quite a distance to go before heading south in wave E of the triangle (which we tentatively plot in the 75-76 area).

On the 2H chart, a bullish interpretation says that we may be preparing to blast higher in wave 3 of c of D, which would take us over 82.50 and into negative territory for our current short.

Summary: Move stops to 81.78. This gives us a minimum 29-pip gain on this pair and will protect us from a take-off a few hundred pips higher. Should price reach 84-88, it may be time to re-enter this trade. However, because 1H momentum has yet to turn bullish, we will stay in this trade for the time being.

Mid-trade analysis: EURAUD (long)

•July 13, 2012 • Leave a Comment

Price has zoomed up in Wave 1 of A rather quickly in this pair and I’m now anticipating a wave 2 correction to the 1.1996-1.2011 area before heading higher in Wave 3. Depending on how the waves subdivide, what we saw over the past 24 hours may simply be wave i of 1 of A, meaning we are now in a wave ii of 1 correction.

In chart form, here is our status in this trade:

 
Based on wave ratios obtained in yesterday’s advance, I estimate the top of wave v at around 1.2190. Depending on wave structure and momentum readings as we approach our limit of 1.2310, I may move my limit downward to the 1.2150-1.2200 area.

Trading Signal: USDCHF (short)

•July 12, 2012 • Leave a Comment

Our trading system has now generated a sell signal on USDCHF.

Here are our trade specs:

Entry now at .9864
Limit: .9550
Stop: 1.0032

This pair, on a momentum basis, is heavily overbought on every chart from 15M out to the Daily. As shown in the 6-hour chart, we seem to have formed nearly a full five waves up and are now anticipating a correction of at least 50%, which gives us a medium-term target of .9478.


The hourly chart suggests that this pair might need a period of consolidation in a fourth wave, however, followed by a new high. Because wave ii retraced nearly all of wave I, we are expecting that the wave v high will extend only slightly (30 to 50 pips) above the wave iii high, which appears to currently be in formation. Due to the strong bearish momentum, it is entirely possible that wave v will be truncated and fail to meet the current price, hence our readiness to enter this trade at the present time.

A more bearish possibility is that wave v shown above will be truncated, failing to surpass the wave iii high. This possibility is signalled by the recent failure of wave iii of stay within the bounds of its Elliott channel, drawn in the chart below.

We will be looking for a clear bullish divergence on the hourly chart to exit this trade, unless our limit is hit first.

Trading Signal: EURAUD (long)

•July 12, 2012 • Leave a Comment

Our trading system has issued a buy signal for EURAUD.

Here are our trade specs: Entry 1 at the current price of 1.1940. Limit: 1.2310 Stop: 1.1746

We are prepared to add leverage at 1.881 for 1.5 times that used in the first trade and again at 1.1813 using leverage equal to that in the first two trades.

This pair has been in a long decline from October 2008 and from a momentum perspective is now appearing oversold on all but the 8-hour chart. This suggests one or two more bottoms may still be in store; however, we are expecting a rise of at least 2% based on current momentum readings. The price action of January to October 2011 looks indicative of a fourth wave, leading us to interpret the action since October as a terminal fifth wave.

Zooming in on the past 10 months, the market has traced out a textbook 5-wave down sequence since October 5, 2011. Standard wave relationships lead us to estimate this decline ending somewhere between the current price and 1.1852. As the ensuing correction should carry to at least 1.3000, given that our trading system has already issued a buy signal, we are not inclined to wait to enter this trade.

Longer-term, we believe the entire decline from 2008 will see at least a 38% correction, bringing price into the 1.5400-1.6500 range.

Post-trade analysis: NZDJPY (long)

•July 11, 2012 • Leave a Comment

Our long trade on NZDJPY proceeded rather speedily to the target zone of 63.52-63.57 today. As with most C waves within an inverted flat correction, this was a ragged, choppy advance capped off with a sharp rally. 

Price is likely to continue to rally higher in the Fibonacci retracement zone, with a likely termination point in the 63.67-63.85 range. Price should then fall precipitously in Wave 3 of a larger impulse (or alternatively, Wave C of a larger correction).

Total elapsed time on this trade was roughly 11 hours, thus producing an average rate of return of around 4.5 pips/hour. We were fortunate to get in and out of this trade quickly as the general trend in this pair seems to have shifted in favor of the bears and thus today’s trade took place within in a countertrend move.

Trading Signal: NZDJPY (long)

•July 11, 2012 • Leave a Comment

Finally, our trading system has issued a long signal after a string of shorts. 

Our unique combination of multiple-timeframe momentum analysis and Elliott Wave indicators has just returned a BUY signal for NZDJPY. Here are the trade specs:

Entry @63.05

Stop @62.02

Limit @63.52

The first entry is for 20% of our maximum single-trade leverage. If price reaches 62.73, we will enter a second long for 1.5 times the leverage used in our original trade. If price reaches 62.37, we will enter a third long with leverage equal to the sum  of that used in the first two trades.

In momentum terms, this pair is oversold on the 15-minute through the 2-hour charts. However, momentum on higher timeframes is bullish to neutral and that is easily understood in terms of Elliott Wave analysis…

In Elliott terms, we have just completed an impulse wave down from 64.39 (July 5) and we are now trading Wave C of an inverted flat correction. I expect price to reach between the .500 and .618 retracement levels (63.65 to 63.83). Our limit, as always, is set somewhat conservatively just below this range.

Unlike most of our trades, which take one to two weeks to complete, I expect this trade to complete within the next two days (i.e., before the trading week is finished). See our analysis in the chart below:


Mid-trade analysis: AUDJPY (short)

•July 9, 2012 • Leave a Comment

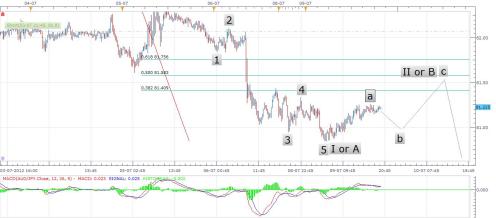
Our short on AUDJPY is proceeding basically according to plan. The market action since Friday has allowed us to update our previous wave count. What we labelled as a five-wave impulse last week turned out to be just wave 3 of a larger 5-wave structure. Now that the higher-degree impulse has finished, the market is correcting back up toward the Fibonacci zone of 81.41 to 81.76.

Typically, a second (or B) wave corrects to between the .500 and .618 Fibonacci retracement levels. Therefore, I estimate that price will reach 81.58 to 81.76 over the next couple of trading sessions. However, as we are expecting a third wave down to follow, the momentum is definitely in the bears’ favor and that means price could break lower at any time. We are well-positioned for both possibilities.

AUDCHF short re-triggered on July 9

•July 9, 2012 • Leave a Comment

Once again, our trading system has returned a recommendation to short AUDCHF. This is not a “revenge trade” in response to last week’s 166-pip loss in this pair; rather, it is a cold and objective response to the results of our trading system analysis.

A short trade has been entered (Entry 1) at the current price of .9951. Stop: 1.0120. Limit: .9844.

A second entry at 1.5 times the leverage of Entry 1 if price reaches 1.0008. A third entry (with leverage equal to the sum of that used in Entry 1 and Entry 2) will be triggered if price reaches 1.0064.

While technical analysis patterns do not enter into our unique combination of momentum and Elliott Wave analysis, the 15-minute chart in this pair is currently displaying what looks to be a head-and-shoulders pattern. This pattern merely bolsters our confidence in the results returned by the trading system.

Even under the most conservative wave count, which sees the rise from .9330 (June 4) to 1.000 as the third wave of a larger structure, price will reach .9837 with merely a 24% correction of what we have tentatively labeled Wave 3 below. Given the consistency of bearish momentum divergences across multiple timeframes, I won’t be surprised to see this pair come as low as .9600, but we will be satisfied to take the easy (higher in the chart) pips in this case.

Should momentum get even more bearish in the coming sessions, we are prepared to revise our limit downward.

Update: AUDJPY breaking impulsively to downside

•July 6, 2012 • Leave a Comment

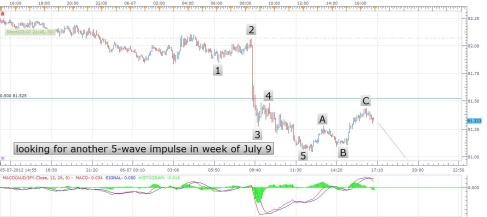
On the short-term charts, the AUDJPY has just completed a five-wave impulse down to 81.03. The impulse was followed by a zigzag (A-B-C) correction, implying a likely further five-wave move downward near the start of next week.

Due to continued bearish momentum on the 1H chart, our trading method calls for a revision of the limit on this trade downward to 79.58, which is just above the .382 retracement level of the entire advance from the January low to this week’s high.

Our trade is now at +75 pips.

Image

AUDCHF trade stopped out for 166 pip loss

•July 6, 2012 • Leave a Comment

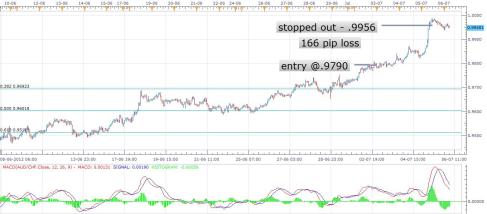
We were stopped out yesterday on our AUDCHF trade for a loss of 166 pips. This was a painful event, but typically in this trading method we get stopped out once in about every ten trades. It was a small consolation that the market moved rather quickly to our stop and that at least frees up our remaining capital for further trading.

Total time elapsed: 86 hours.

Our only open trade right now is our short on AUDJPY, which is at +10 pips currently. I am expecting the AUD to finally start moving over the next 48 trading hours, so this should help move that trade to some sort of resolution.

Image